Philosoraptor
Well-Known Member
A few doodles to see if there are any patterns in the data.
First off, the Glicko-2 representation of the league based on team strength rather than 3pts for win, and 1pt for a draw.

Glicko-2 has Ipswich Town as the strongest team but Leicester City scored more league points to tip it.
A better view of what was going on over the course of the season can be found in this representation of the league below.

I might as well chuck in the other three seasons since Coventry has been back in the Championship.
2022/23

2021/22

2020/21

If we put all this stuff together we can put City's rating over the last 4 years in a chart with the usual disclaimer that each seasons grading is based on the environment it is played in. It is possible a teams grading can go down whilst the team strength goes up, and visa versa.
I currently have City on (1493) at the close of the season.

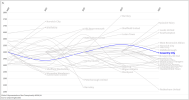
Of course, if it is possible to do Coventry's grading then it is possible to do the same for all the teams in the league. This brings us to the lump of spaghetti below.

I think the call of (1375) for relegation and (1600) for a play-off position is a good one. It could be (1550). Even if the gradings are a measure of the environment the teams are in each season, it could show empirically if there are trends of travel for teams in the league each season, and if teams are geting stronger or weaker in relation to one another.
Here's the same chart but zoomed in from (1375) to (1575) to loosen the spaghetti up a little.
First off, the Glicko-2 representation of the league based on team strength rather than 3pts for win, and 1pt for a draw.

Glicko-2 has Ipswich Town as the strongest team but Leicester City scored more league points to tip it.
A better view of what was going on over the course of the season can be found in this representation of the league below.

Championship 2023/24 (complete)
flo.uri.sh
I might as well chuck in the other three seasons since Coventry has been back in the Championship.
2022/23

Championship 2022/23 (complete)
flo.uri.sh
2021/22

Copy of Championship 2021/22 (complete)
flo.uri.sh
2020/21

Championship 2020/21 (complete)
flo.uri.sh
If we put all this stuff together we can put City's rating over the last 4 years in a chart with the usual disclaimer that each seasons grading is based on the environment it is played in. It is possible a teams grading can go down whilst the team strength goes up, and visa versa.
I currently have City on (1493) at the close of the season.

Of course, if it is possible to do Coventry's grading then it is possible to do the same for all the teams in the league. This brings us to the lump of spaghetti below.

Championship 2020/24
flo.uri.sh
I think the call of (1375) for relegation and (1600) for a play-off position is a good one. It could be (1550). Even if the gradings are a measure of the environment the teams are in each season, it could show empirically if there are trends of travel for teams in the league each season, and if teams are geting stronger or weaker in relation to one another.
Here's the same chart but zoomed in from (1375) to (1575) to loosen the spaghetti up a little.
Championship 2020/24 (1375) - (1575)
flo.uri.sh
Attachments
Last edited:


